‘Rule Forty-two. All persons more than a mile high to leave the court .’
Everybody looked at Alice.
"Population, when unchecked, increases in a geometrical ratio, Subsistence, increases only in an arithmetical ratio."
–Thomas Malthus
"Evolution is the result of a sequence of replacements."
–Elliot W. Montroll
Over the last 8 years Apple's revenue has grown from $6.6b in calendar 2003 to $128b in calendar 2011, a 19.4x increase, or an annualized compound rate of 45% per year. Most astonishingly, EPS (including some substantial share dilution) has grown from 13 cents in 2003 to a whopping $35.11 in 2011, a 270x increase, or annualized to a compound rate of 101% per year. That's more than the equivalent of doubling every single year for eight years (2^8=256 times).
In light of such an impressive long-term performance, last quarter's 73% and 116% Y/Y growth, in revenue and EPS respectively, may seem like par for the course. Indeed, this is the way many "savvy" yet uninformed investors characterize Apple and AAPL: as a momo growth stock bound to fall off a cliff (so many examples from last year: NFLX, RIMM, FSLR, APKT, SINA, just to name a few) as soon as the scorching growth cools down a bit (and it will sooner or later, that's an undistputable fact).
What has caught everyone off guard is that this isn't supposed to happen, ever, from a company this big. It was perhaps acceptable during the iPod era when Apple was small and EPS could easily grow at 3-4 hundred percent for a couple of years off of a low base. It could be explained away as a one-hit wonder and the lost opportunity dismissed as such.
But not now. That old "Law of Large Numbers" (cleverly nicknamed the "LoL Numbers" in a comment at Apple 2.0 by someone to whom I wish I could give proper credit, since I forgot their user name) prohibits it. Thus, because this unprecedented growth certainly can't go on, professional analysts, on average, have pegged Fiscal Year 2013 EPS growth at a "reasonable" 11.7%. And as such, AAPL now commands a run-of-the-mill PE multiple of 12.7 times trailing EPS. Makes perfect sense! Regardless, they can continue to estimate 19% long-term growth over the next 5 years, since no one really takes that one seriously.
/s
Sarcasm aside, how can one factually dispute that a significant slowdown is inevitable? Surely it is inevitable, at some point, but what about the drastically short timeframe predicted? Shouldn't it be much more "reasonable" to model a more gradual slowdown? Perhaps in a period of 3-5 years before we dip so close to single-digit growth, and in the meantime we might learn if there are any new products (like the much hyped TV) that could give credence to a healthier, more sustainable double-digit growth rate for the long-term future.
The "LoL Numbers" is a general principle, more like a rule of thumb, which basically states the obvious: constant relative growth (i.e. exponential growth) implies ever increasing absolute amounts grown. Thus, given resources are finite, such growth must slow down, and eventually stop. Duh!
Nowhere it is written that the "law" gets triggered once something becomes the biggest in its category (as some have sworn as true), nor does it get triggered when a company reaches $400b in market cap, as I saw "proven" by some genius at Seeking Alpha (I believe, or maybe it was CNBC). $200b revenue? Nope, not then, either. It doesn't get triggered at some arbitrary threshold conveniently defined by those who missed the train and hope for a lower entry. The principle can only be tentatively applied if there is evidence that the resources for growth are becoming scarce, which requires at least 2 things (and perhaps more): that the addressable markets for the products and services offered by the company in question are no longer expanding and at the same time the company in question has a dominant position in those markets. Both of these conditions are necessary to have strong evidence that the resources for growth are becoming difficult to obtain by the company, indicating saturation.
For Apple, that first requirement of participating in a saturated market doesn't apply for smartphones nor tablets, and the second requirement of market dominance doesn't apply to either iPhone (19% share of smartphones, 5% share of all phones), nor Macs (5% share of traditional PCs). If sales in the traditional PC market, which only recently began giving signs of saturation (although it's too early to tell if the stagnant growth is not just the result of the poor macro environment affecting business spending), consistently start showing more significant declines than a few percentage points, then we might consider the possibility that Mac sales growth could stall. But only if Apple were to suddenly fail to innovate in the space and take market share, as they have done for the last several years, would there be a strong case for significant declines. There is no evidence to suggest that this may be happening, or will happen within a year or so.
But even if it were to happen, if Mac sales were to plateau or start a consistent decline (for more than a couple of quarters), one should then evaluate the contribution of Macs to the overall company performance, and only if the impact is bigger than other sources of growth, then one could say overall growth could stall. Even then, all of that could still end up being temporary, as Apple doesn't stand still.
The only product for which both conditions do apply is the iPod line, in particular the non iOS-capable iPods. This market has long been under strong disruption forces from the integrated media playing capabilities of good old cheap feature phones (not to mention smartphones and tablets and now cloud services). Further, Apple does "suffer" from a dominant lead in the dedicated digital music player market (>70% share). However, at 5% of Apple's overall revenues over 2011 (2.5% estimated for 2012) the iPod no longer has any meaningful effect on company growth, and this has been a known fact for a couple of years already. Of course, once an equilibrium gets reached in the dedicated media player market, when the user base settles at a stable level of annual sales, then the declines would stop, and then the iPod touch might carry the iPod line back into positive growth (perhaps very soon). Again, all of it is meaningless given its small contribution to revenues. The same applies to decelerating software and services revenue growth with its small contribution (although still growing slowly as opposed to iPod's dramatic double-digit declines).
So I'd like to know if these analysts are predicting either the smartphone or the tablet markets reaching saturation within a couple of years, or perhaps they're projecting a collapse in Apple's ASPs (historic pricing patterns for Apple suggest quite the contrary), or a collapse in margins (even further from historic margin trends). A combination of at least two or more of those (and not just an isolated data point like the last September quarter) are the only things that could potentially put a screeching halt to EPS growth, from triple digits now to near single digits in a year or two. So what's the evidence for any of it? I'm listening. And don't come back with the broken theory that strong competition from Android is pressuring iPhone's margins. Go read the recent news. I'm now starting to read more about Microsoft's recent great advances in their mobile OS... or was that on ARM tablets? I tend to forget because it seems like I've heard the same promises every year for at least 5 years. So please, someone play devil's advocate or something and provide a slightly sensible reason for the projected slowdown.
Anyway, even though the burden of proof should be on them, on those who predict less than 12% growth following more than 50% for 2012 (their own low estimate), I'm not expecting anyone to come up with a believable justification. The consensus will stand, just like 2012 growth estimates stood at 15% for all of 2011, and only now, after the fact, they began moving it up (from 15% to 50% as if it was nothing). No diligent investor should ever rely on pro analysts doing their due diligence for them.
Because of that, I will take it upon myself to come up with a data-driven factual argument disproving the drastic deceleration, and instead perhaps allowing for a much more gradual deceleration, just to be conservative, but quite possibly continued strong growth over much more than a couple of years, and without even counting on any new products' pie-in-the-sky revenue streams. Again, this should be the given premise in an efficient market in light of the company's performance, not the other way around, but it's clear (for quite a few years now) that the market is anything but efficient. As I've often said before, this inefficiency represents quite an opportunity.
So, the best way I can think of evaluating the potential for continued growth and the possible timeframe for reaching market saturation limits for Apple which could result in single-digit growth rates, or even declines, is by using the old, well known descriptive growth models from technology/customer/product adoption life-cycles, diffusion of innovations, and some disruption concepts (to a much lesser extent since the focus here is on existing product lines providing sustaining rather than explosive growth).

The s-shaped curve in this example image (left) is labeled as representing market share, but it can also model many other business metrics (usually stock but also sometimes flow quantities under non-disruptive replacement cycles). Therefore the saturation area to the right does not necessarily imply near 100% market share. In the case of Apple and personal computing (both traditional and mobile), I prefer to use it to model the size of the customer installed base, and then the rate of change of this installed base, plotted over time would tend to fit the bell-shaped curve.
A distinction should be further made with the commonly used financial markets' metric of y/y growth as a percent, which is not simply this rate of change modeled by the bell curve, but the ratio of that change over the absolute quantity. More formally,
y(t) = Installed Base (IB) should follow the s-shape
y'(t) = d(y)/dt = Changes in IB (yearly in this case) should follow the bell shape
y'(t)/y(t) = When expressed as percent growth is what financial markets refer as y/y (or q/q) growth.
Warning: I might get a little bit technical here so, if you want, you can stop right here and wait for a couple of days (I hope by Monday) when you'll be able to jump right into the Apple and industry data (roughly) showing these patterns (do check out the last chart advanced at the end of this post). The math that follows isn't too hard though, so I thought it'd be nice to show how some of these curves come up in this type of modeling through a couple of simple examples.
For a first example, a simple way to formulate those equations might be to assume that the percent or relative growth declines exponentially over time:
y'(t)/y(t) = e^(-r t)
This first order linear differential equation resolves to:

The constants c_1 and r only change the scaling of height and time of the curve, so we can arbitrarily set them both to 1 just to see what this looks like in general (left figure): y=e^-e^-t
The derivative (rate of change y') of that is e^(-e^(-t)-t) which is a slightly skewed bell shaped curve (right figure).

That first function y=e^-e^-t is the simplest case of the Gompertz function family, with many applications in modeling growth of various kinds, from cancer tumors to mobile phone adoption.
For a second and final example (thanks for enduring all this hopefully illustrative math), lets consider a "market share" case where y(t) models market share, and we'll intuitively assume that the relative growth (y'/y) is determined by the remaining share to conquer before saturation (100% - y), thus: y'/y=1-y which is a first order nonlinear (because there's a y^2 term there) differential equation, and resolves to:

Once again, to see what it looks like we'll arbitrarily set the scaling/displacement constant c_1 (this time to equal zero) so we get e^t/(1+e^t) (left figure).
This equation can also be written as 1/(1+e^-t) which is the most common way of stating the (standard) logistic function.
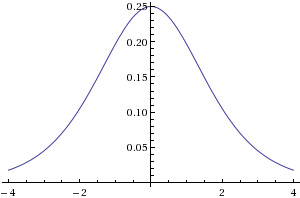
Despite the similarity, it shouldn't be confused with the well known normal or Gaussian bell curve (a simple example showing its shape is e^-t^2) which has a slightly fatter central bump and lower tails than the logistic.
Finally, the relative growth (y'/y) simplifies to 1/(1+e^t), which is the same logistic we started with except flipped horizontally (or vertically and then displaced one unit higher, adding 1 to -y thus y'/y=1-y as we originally required). It models the decline in the relative growth rate in exactly the same manner as the increase in market share, just as we described it at the onset (or vice-versa if we were modeling market share declines).
Alright enough of all that nasty math. Let all that sink in for a bit, maybe explore some of these ideas on your own, while I work on preparing all the cool Apple data. Hope this was somewhat instructive so you can use it as a powerful tool in a more insightful interpretation of not only the data for Apple that I'll share next, but also on any other kind of business growth trends analysis you might find applicable.
Oh okay, fine. I'll tease you with the following chart... see if you can spot any patterns of slowing adoption or perhaps even saturation (click to enlarge).

This is based on the long term unit sales data for the whole traditional PC and mobile PC industries compiled by Asymco's Horace Dediu, who in turn built on data compiled by Jeremy Reimer (I've updated it with the latests results from Apple and a few fixes I thought necessary).
(part 2 continues here)


4 comments:
As there has been little written here between earning periods of late, I thought you might be losing interest, possbily discouraged by the low valuation of the stock given the unbelievable performance of the company over the past few years. Having said this I believe this is one the best articles you have written to date.
Congratulations on speaking up and explaining why we are see this tragic valuation by pro analysts. With the doors just opening into China, seeing the pent up desire for Apple products in that country, even causing riots at the stores... iPad manufacturing moving into Brazil.. I see no slowdown in growth for years to come.
Anyway, nice work on this most recent blog. We can only hope a few analysts migrate here, read your words and begin to understand how Apple should really be valued.
Can't wait for part 2!
Great analysis. Btw, Where do you get these quotes from ?
I can't thank you enough, not only for modeling Apple's growth, but also for modeling how to correct irrational beliefs using information analysis.
Post a Comment